Help your data get ahead: the benefits of the Real Estate Cockpit for real estate reporting
Many companies in the real estate business still do not adequately analyse and interpret the data available at their company. They spend a lot of time preparing the data and drawing up charts. Users frequently complain about long waiting times when calling up large data volumes. Existing solutions are often difficult to operate and not very user-oriented. For this reason, until now analysts restricted themselves to the analyses that are essential for daily business. However, when we take into account the rapidly increasing data volumes and the information requirement resulting from this, is this approach sufficient?
Modern tools for reporting have long made it possible to venture deep into the analysis of existing data. But now, thanks to SAP HANA® technology, this is also becoming increasingly user friendly and much faster. As early as 2011, SAP spread the message that they wanted to become “Apple simple, Google fast”1. Now, with the SAP Real Estate Cockpit, this strategy is being used in practice for decision makers in the real-estate industry.
Optimise performance with convincing tools
With the new SAP HANA® database technology, data can now be presented live with high performance. The route to presenting the data is also less time-consuming, as the previous transformation and loading processes are eliminated and the “live data” can be modelled with great flexibility. This is made possible not only thanks to the fast and efficient in-memory technology of the database. In accordance with the push-down principle, even more complex calculations are already performed at database level by outsourcing part of the logic of the application system to the database.
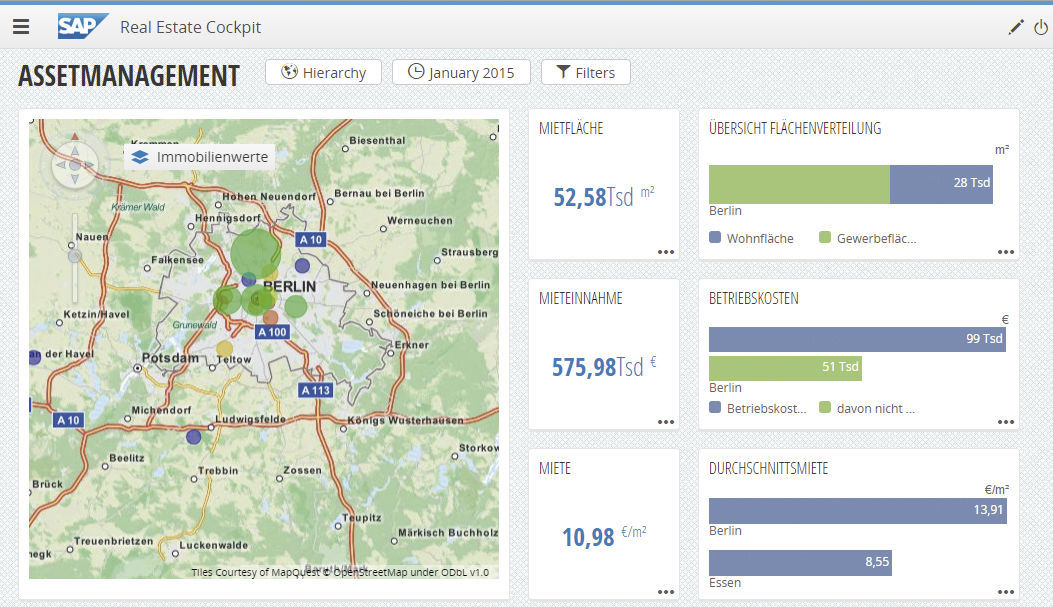
With the SAP HANA® Studio development and modelling environment, an application based on the Eclipse development environment, you can create info providers and views. Views are the means with which to see the pure figures in the database. Tools such as SAP Lumira® or applications that were created using SAP® BO Design Studio make the views visible in a way that users can understand. These tools now also include the browser-based SAP Real Estate Cockpit, which is supplied together with RE-FX on HANA. This tool can combine data from various internal and external data sources and display it in real time.
SAP already provides a few pre-defined views for SAP Real Estate Cockpit with HANA® Live. These contain information regarding master data, measurements, conditions and cash flows for both the use-oriented and architectural view of the ERP data. With SAP HANA® Studio, these pre-defined views can be adjusted to suit your requirements or used to model individual views. Generally, views can be used to access any table in the SAP® ERP database. This allows you to combine pure real estate data with financial data and other data.

Role-specific cockpit with individual views
PROMOS has already gained initial experience with the SAP Real Estate Cockpit. On the design side, the first step here was to clarify which information from the HANA database is of interest. The gif2 approach was used as a basis for a prototype of the SAP Real Estate Cockpit. For this, the real estate management tasks were divided into the functional areas of company management, portfolio management, asset management, and commercial and technical property management. These functional areas differ as a result of the different tasks and responsibilities. As a result, the required information for each area differs according to the purpose. On the one hand, this means restrictions to the data inventory in accordance with the area of responsibility or sub-portfolio. On the other hand, different information is transferred in accordance with the functional area or task area.
For example, the property value with regard to the overall real estate portfolio is relevant for the company management. Portfolio managers, on the other hand, are interested in the property values of sub-portfolios and compare these with one another. Asset managers focus on their own real estate portfolio and the individual properties within it. Commercial property managers require more rental and contract information. Technical property managers want to be informed about maintenance planning or open repairs reports. All of this data is collected, consolidated or combined in SAP HANA® Studio in views and the relevant KPIs are modelled.
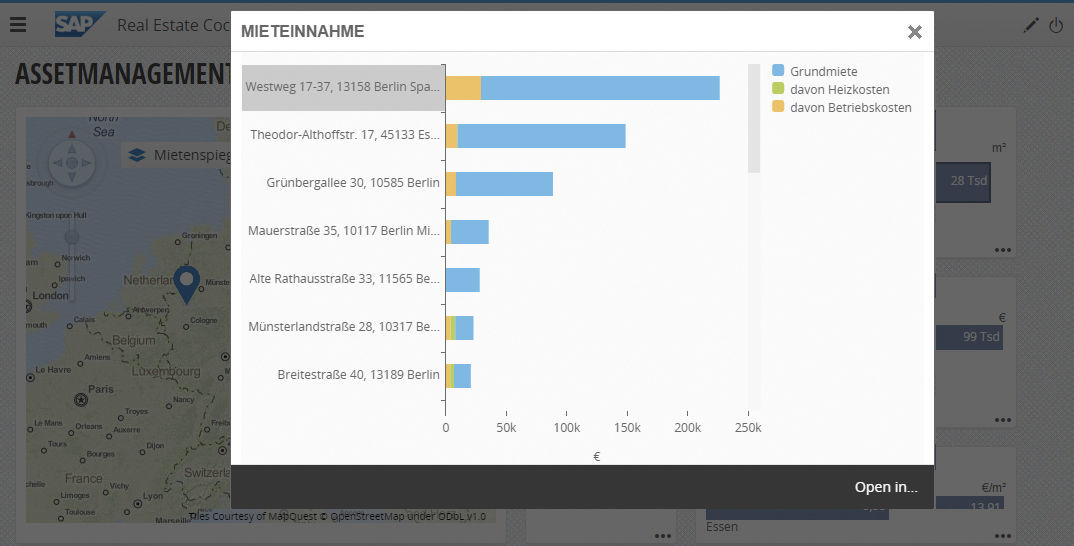
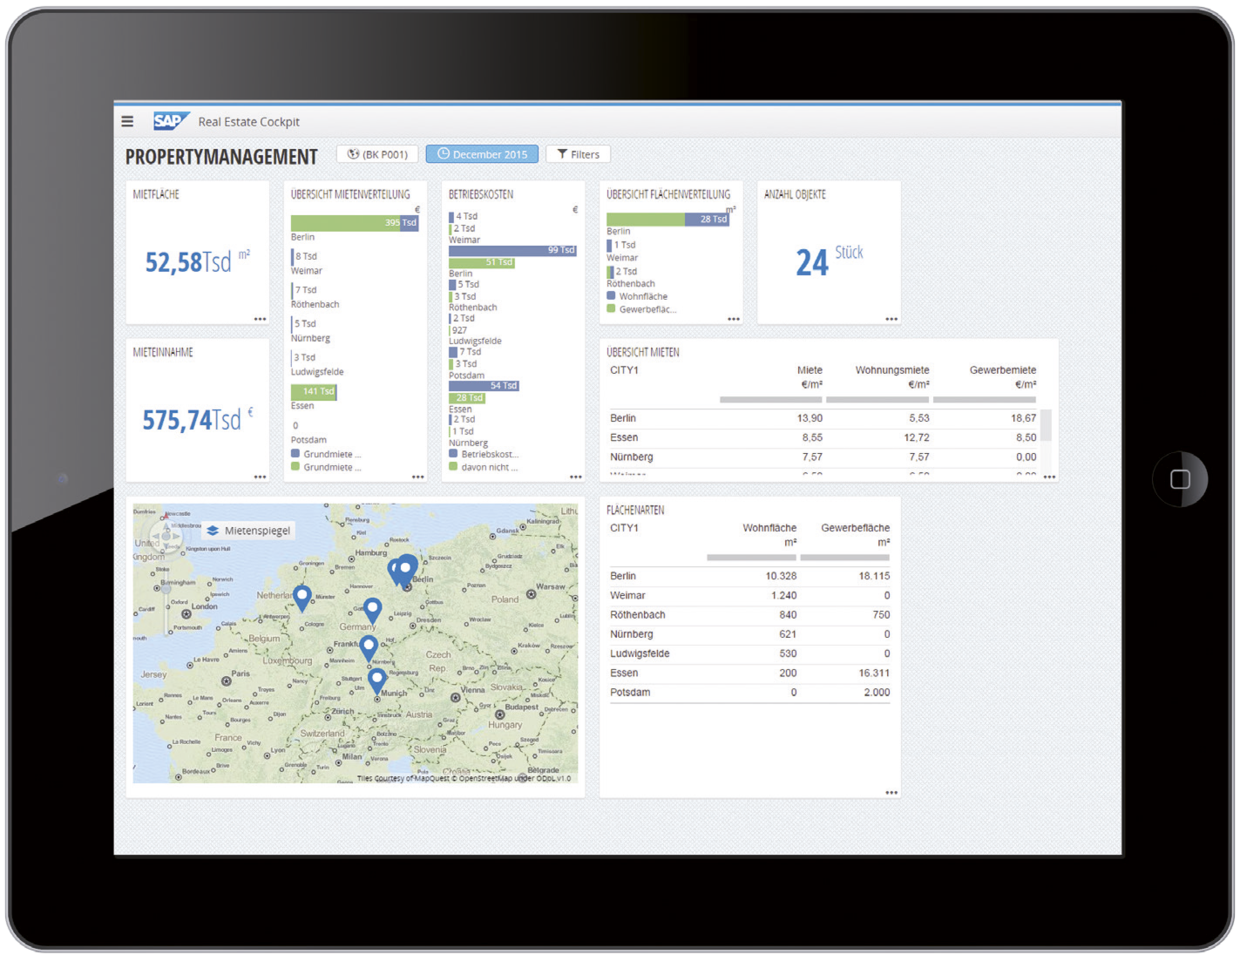
With the browser-based SAP Real Estate Cockpit Configurator, in a second step the views have been connected to the SAP Real Estate Cockpit as a data set and semantics have been created on this basis. One semantic defines the individual meaningful KPIs, graphics and diagrams in components. Here, you can specify filters, set aggregation levels, generate further key figures in addition to those contained in the views by means of simple calculations, and create links for jumping directly to SAP transactions. Moreover, hierarchies provide the option to filter data at the level of individual hierarchy nodes. You can show the properties on a map with selected information using geographic coordinates. The properties can be distinguished based on features using coloured pins or bubbles.
The
individual role-based dashboards for each functional area are then compiled in
the SAP Real Estate Cockpit based on the configured components largely by
dragging and dropping and then assigned to individual roles or users.


Summary
The SAP
Real Estate Cockpit is a modern tool from SAP that allows you to analyse ERP
data from the HANA database in real time. Meaningful KPIs, graphics and
diagrams can be displayed in role-based dashboards via a browser. Filters,
hierarchies and map views allow the analyses to be examined in greater detail.
In addition, the Real Estate Cockpit can be combined with mobile terminal
devices, meaning users always have access to the information that is important
to them. In the opinion of PROMOS, the SAP Real Estate Cockpit is a
well-designed tool for contemporary preparation and visualisation of
information from an SAP® ERP database. Combined with a sound real estate concept,
it is the right choice for fast data analyses and well-founded decisions.
- Wirtschaftswoche, 10.11.2011, http://www.wiwo.de/unternehmen/it/sap-einfach-wie-apple-schnell-wie-google/5821872.html
- Gesellschaft
für Immobilienwirtschaftliche Forschung e. V.
Author:

Frank Freyer
Director Business Intelligence Consulting
PROMOS consult

